04 Data manipulation
question Questionsobjectives Objectives
- How to manipulate variables?
- get an overview of general functions to manipulate variables
- get an overview of functions helpful for working on large data sets
- get an overview of functions to find indices of specific elements
- learn how to identify and convert data types
time Time estimation: 45 minutes
Manipulation of variables
General functions
The big difference between R and other programming languages is that functions in R are designed to be applied to variables rather than to individual values to avoid loops e.g. if we want to log transform a whole dataset we can do this using a single operation:
> v <- c(1,10,100,1000,10000)
> log10(v)
[1] 0 1 2 3 4
The log10() function is written in such a way that it can be applied on a vector. This is true for all functions and operators in R:
> v - 1
[1] 0     9    99   999  9999
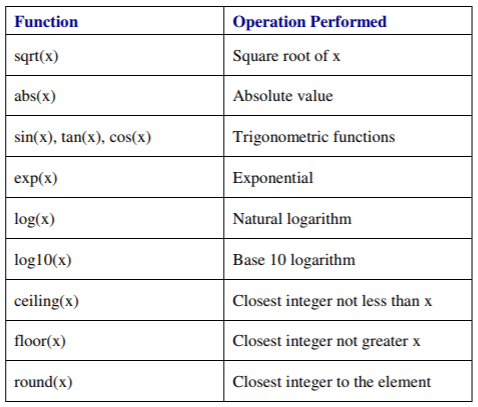
R has built-in functions for virtually any standard mathematical task.
Arithmetic operators can be used on variables. Provided that the variables have the same dimensions, you can do element-wise addition, subtraction, multiplication and division of two vectors or tables. Element-wise means that the calculation is performed on the equivalent positions between the two variables: first element + first element, second element + second element etc.
> v1<-c(1,2,3)
> v2<-c(4,5,6)
> z<-v1+v2
> z
[1] 5 7 9
If you perform operations on vectors with different lengths (not recommended) then the vector with the shorter length is recycled to the length of the longer vector so that the first element of the shorter vector is appended to the end of that vector (a way of faking that it is of equal length to the longer vector) and so forth. You will get a warning, but R does let you perform the operation:
> x1 <- c(1,2,3)
> x2 <- c(3,4)
> x3 <- x1 + x2
Warning message:
In x1 + x2:
  longer object length is not aa multiple of shorter object length
> x3
[1] 4 6 6
hands_on Hands-on: Demo
From the demo script run the Operations on variables section
hands_on Hands-on: Exercise 13a
- Calculate log base2 of the activity in Drug_study
- Round the result to the nearest integer
solution Solution
 log.act <- (log2(Drug_study$activity))
 round(log.act)
hands_on Hands-on: Extra exercise 13b
- Create vector v as the sum of newVector and threes using an arithmetic operator
- Print the content of v
- Do the same for newVector and vector x2 with elements 3,1
- Join the elements of newVector and threes into 1 vector q
solution Solution
 v <- newVector + threes
 v
 x2 <- c(3,1)
 newVector + x2
  q <- c(newVector,threes)
hands_on Hands-on: Exercise 13c
- Add a column called geneDensity to genomeSize containing the number of bp per gene for every organism
- Round the numbers to the nearest integer
solution Solution
 dens.fl <- genomeSize$size / genomeSize$geneCount
 genomeSize$geneDensity <- round(dens.fl)
Some functions only work on vectors. For instance sort() will sort data from smallest to largest (arguments allow other ordering) and order() returns the indices of the sorted elements:
x
[1] 1 3 11 1 7
sort(x)
[1] 1 1 3 7 11
order(x)
[1] 1 4 2 5 3
In the sorted vector the first element is also the first element of the original vector, the second element of the sorted vector has index 4 in the original vector etc. To sort a data frame use order() inside square brackets:
mtcars[order(mtcars$mpg),]
To sort on two columns (first on mpg, then on cyl):
mtcars[order(mtcars$mpg,mtcars$wt),]
To sort in descending order place a minus sign in front of the variable:
mtcars[order(mtcars$mpg,-mtcars$wt),]
Select the labels of a vector or table using names(). For tables rownames() and colnames() can access or set the either row or the column labels. Both functions will not work on vectors.
The length() function retrieves the number of elements of a vector. Used on data frames it doesn’t throw an error but returns the number of columns instead.
The same is true for match(x,y). It compares x and y and returns a vector with the same length as x containing:
- NA for elements of x that are not in y
- the index in y for elements in x that are in y
On data frames it will not do an element-wise comparison but a column-wise comparison:
match(D1,D2)
will return a vector with length equal to the number of columns in D1 containing:
- NA for columns of D1 that are not in D2
- the index in D2 for columns in D1 that are in D2 (so the complete column has to match, not the individual elements)
Important is to see the difference between the + operator and sum(). The former works element-wise on two variables, the latter calculates the sum of all elements of one vector.
There are also functions to be used only on tables, e.g.
- dim() returns how many rows and columns a table has, nrow() and ncol() will get these values individually
- t() transposes matrices (exchanges rows and columns), the output is a transposed matrix: the columns are the rows of the original matrix and vice versa
Use merge() to join two data frames. Let?s say D1 has a column A with values. Data frame D2 has the same values stored in column A. Merge the two data frames on the basis of this common column:
newD <- merge(D1,D2)
If (some of) the values of the common column differ, merge() will ignore these values. Use argument all.x to add an extra row for every different value to the resulting data frame. All rows where the values of the two data frames don?t correspond, will be filled up with NA values.
Most functions operate on numbers but there are also functions for manipulating text, e.g.
paste(x,y,sep=" ")
concatenates two strings x and y (glues them together into one string) separating them by the character defined by sep. Arguments x and y can be strings but they can also be vectors. If they are vectors, they are concatenated element-wise to give a character vector result.
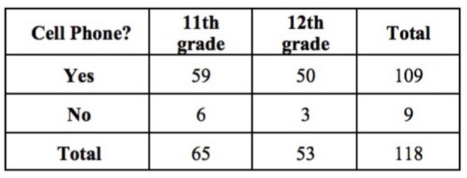
Furthermore there are also functions specific for factors. For instance to select the names of the categories (levels) of a factor use levels() and table() to create a contingency table.
table(cell_phone_data$own, cell_phone_data$grade)
hands_on Hands-on: Exercise 13d
You repeat the plant study experiment this time having the following numbers of plants developing lesions: 1, 6, 6, 5, 4
- Add these data as a third column to the data frame
- Relabel columns to Day, Infected and Repeat
- Use paste() to add the word ?day? to the elements of the Day column. Look at the documentation first !
solution Solution
 Plant_study$repeated <- c(1,6,6,5,4)
 names(Plant_study) <- c("Day","Infected","Repeat")
 ?paste
 Plant_study$Day <- paste(Plant_study$Day,"day",sep="")
question Question
What will happen when you run this code ?
paste(Plant_study[,"Day"],"day",sep="")
hands_on Hands-on: Exercise 13e
- Change the label of the second column of Drug_study to drug
- How many rows does Drug_study contain?
- Order the rows according to decreasing activity
solution Solution
 colnames(Drug_study)[2] <- "drug"
 nrow(Drug_study)
 Drug_study[order(Drug_study$activity,decreasing=TRUE),]
question Question
What happens when you run this code ?
colnames(Drug_study$ID) <- "id"question Question
What happens when you run this code ?
colnames(Drug_study[2]) <- "blabla"question Question
What will happen when you run this code ?
Drug_study[order(Drug_study$activity),"ID"]question Question
What will happen when you run this code ?
 n <- order(Drug_study$activity,decreasing=TRUE)
 Drug_study[n,]
hands_on Hands-on: Extra exercise 13f
- Sort the elements of z from smallest to largest
- Now use order(z). What’s the difference with the previous exercise?
- How many elements does z contain?
solution Solution
 sort(z)
 order(z)
 length(z)
hands_on Hands-on: Extra exercise 13g
Add a new row to data frame ab containing values: 3,4,7
solution Solution
 d <- c(3,4,7)
 ab <- rbind(ab,d)
hands_on Hands-on: Extra exercise 13h
- How many rows and columns are in the built-in data frame CO2 (data on CO2 uptake by plants)
- Use levels() to retrieve the names of the Treatment categories
- Create a contingency table with counts (number of plants) in every category of CO2 that is defined by Type and Treatment
- Use unique() to count how many plants were studied
solution Solution
 dim(CO2)
 levels(CO2$Treatment)
 table(CO2$Type,CO2$Treatment)
 length(unique(CO2$Plant))
Functions helpful for working with large data sets
Research in biology/medicine often generates very large data sets. When you work with very large data sets, it is often useful to show only a small part of the data set;
- head() shows the first 6 elements (vector) or rows (table) of a variable
- tail() prints the last 6 elements or rows
hands_on Hands-on: Exercise 14a
- View the first 6 rows of the mtcars data frame
- Return TRUE if mtcars contains cars with 6 gears and FALSE if not
- How many cars with 3 gears are in mtcars?
solution Solution
 head(mtcars)
 nrow(subset(mtcars,gear==6))!=0
 nrow(subset(mtcars,gear==3))
Functions for finding indices of specific elements
There are functions that help you locate specific values, the which functions:
which.min(x)
which.max(x)
return the location (index) of the minimum, maximum or a specific value of a vector x. So max() will return the highest value in the data, which.max() will return the index of the highest value in the data.
The argument of which() is a logical expression and which() will return the indices of the elements for which the logical expression is TRUE.
x <- c(1,5,8,4,6)
x
# [1] 1 5 8 4 6
which(x == 5)
# [1] 2
which(x != 5)
# [1] 1 3 4 5
hands_on Hands-on: Exercise 15a
Get the data of the patient with the highest activity in Drug_study
solution Solution
Drug_study[which.max(Drug_study$activity),]question Question
What will happen when you run this code ?
 n <- which.max(Drug_study$activity)
 Drug_study[n,]
hands_on Hands-on: Exercise 15b
- Get the index of the column called cyl in mtcars
- Create a data frame that contains the car with the lowest mpg for each category of cyl
solution Solution
 which(names(mtcars)=="cyl")
 C4m <- mtcars[order(mtcars$cyl,mtcars$mpg),][1,]
 C6 <- subset(mtcars,cyl==6)
 C6m <- C6[which.min(C6$mpg),]
 C8m <- mtcars[order(-mtcars$cyl,mtcars$mpg),][1,]
 rbind(C4m,C6m,C8m)
Checking and converting types of variables
To check the data structure of an object you can use str() and the generic class() function:
class(c(10,12,30))
# [1] "numeric"
class(c("alana","britt","chris"))
# [1] "character"
class(c(TRUE,TRUE,FALSE))
# [1] "logical"
You can also use the specific is. functions e.g. is.numeric(), is.character(), is.Date(), is.vector(), is.matrix(), is.data.frame() etc.
The is.na(x) function returns TRUE when an element of x is missing:
x <- c(1,2,3,NA)
is.na(x)
# [1] FALSE FALSE FALSE TRUE
To recode values to missing values you don?t need is.na(). Select the rows that contain the value you want to recode, e.g. 99, and change the value using an assignment:
data$v1[data$v1==99] <- NA
To exclude missing values you can use is.na() but there are alternatives. The problem with missing values is that when you apply arithmetic functions on variables that contain missing values they will return missing values and you will have no result. To circumvent this problem many functions have the na.rm argument. If you set na.rm=TRUE missing values are deleted before calculations are done.
mean(x)
# NA
mean(x,na.rm=TRUE)
# 2
The function na.omit() allows to create a new vector without missing values. If you apply this function on a data frame it will remove complete rows that contain one or more NA-values.
newdata <- na.omit(x)
You can convert the data type of an object by using the as. functions e.g. as.numeric(), as.character(), as.Date(), as.vector(), as.matrix(), as.data.frame() etc.
hands_on Hands-on: Demo
From the demo script run the Checking and converting data types section
hands_on Hands-on: Exercise 16a
We created a vector containing the days of the week and loaded this into a data frame called Plant_study. If we want to replace the days of the week by real dates, how should we proceed?
To create a Date object in R:
- define the date as a string in the following format: 1970-01-01
- transform the string into a date by using as.Date()
- Replace the days of the week by the dates of this week
- What type of data is Plant_study ?
- Convert Plant_study into a matrix called PS
- Did the conversion work? Look at the matrix to see if there is a problem.
solution Solution
 Plant_study$Days <- as.Date(c("2019-01-09","2019-01-10","2019-01-11","2019-01-12","2019-01-13"))
 class(Plant_study)
 PS <- as.matrix(Plant_study)
 PS
hands_on Hands-on: Extra exercise 16b
- Check the data type of the second column of Drug_study. Retrieve the column using a comma.
- Convert the second column into a vector.
- What is different now? Look at the vector.
solution Solution
 class(Drug_study[,2])
 v <- as.vector(Drug_study[,2])
 v
hands_on Hands-on: Exercise 16c
Instead of deleting missing values with na.omit() you can select the non-missing values.
- Create a vector with a missing value
- Multiply all elements with 2. What happens?
- Check if the 2nd element is missing
- Delete the missing value using is.na() and the strategy above
solution Solution
 x <- c(1,2,3,NA)
 x*2
 is.na(x[2])
 x[!is.na(x)]
hands_on Hands-on: Extra exercise 16d
- Check if z is a vector or a data frame
- Check if z contains numbers or characters
- Convert z into a matrix
- Convert the elements of z into characters
solution Solution
 is.vector(z)
 is.data.frame(z)
 is.character(z)
 is.numeric(z)
 as.matrix(z)
 as.character(z)
hands_on Hands-on: Extra exercise 16e
- Create a vector called words containing Hello, Hi
- Convert the words into numbers. What happens?
solution Solution
 words <- c("Hello","Hi")
 as.numeric(words)
R is smart enough to catch you if you try to do an illogical conversion, such as convert characters to numbers. It does the conversion but the data is converted to NA values.
keypoints Key points
- We showed an overview of functions for manipulating variables
- We showed how to check and convert data types