06 Protein-ligand interaction - from small molecule to protein
question Questionsobjectives Objectives
- How can visualisation techniques help to derive biologcial insights?
- Which tools exists to display interaction of e.g. small molecules with proteins?
- Describe which interaction types are important for e.g. ligand binding to a receptor.
time Time estimation: 30 minutes
Introduction
The goal of this exercise is appreciate how protein interactions can be studied through visual inspection and other software tools. Protein interactions can be classified into different groups regarding the molecular properties and functions of the interacting partners. (These groups are intertwined in several cases.) Some examples include:
- the interactions of proteins with other proteins, small molecules, carbohydrates, lipids or nucleic acids;
- Receptor-ligand interactions;
- Antigen-antibody interactions;
- Enzymatic interactions, enzyme-inhibitor interactions.
Exploring the structure of a nanobody-stabilized active state of the β2 adrenoceptor - the ligand
We will start with exploring one crystal structure of the β2 adrenoceptor. Together with the Steyaert lab from VIB, Kobilka published several crystal structures of the β2 adrenoceptor in its various activation states (Rasmussen et al. Nature 2011, 477)
hands_on Get the structure
Download the crystal structure 3P0G from the PDB into YASARA.
File - Load - PDB file from internetAs you can immediately appreciate, it is a bigger crystal structure with more than one molecule.
question Questions
- How many molecules are present in the crystallized structures?
- And how many chain identifiers are used?
solution Solution
- There are three molecules, chain A Beta-2 adrenergic receptor; Endolysin, chain B Camelid Antibody Fragment, and a small molecule ligand. Also have a look at PDBe 3P0G which gives a very nice overview of the structure and its composition.
- Only two chain identifiers A and B. Sometimes, this leads to issues depending on the software you might want to use for downstream processing.
Some software routines need seperate chain identifiers for molecular entities to work correctly, so we suggest to rename the small molecule to chain L.
hands_on
- Activate the Head-up display
- Select Rename
- Enter ‘L’ to proceed with the renaming.
We first have a look whether we can find out if there are specific interactions of the small molecule ligand with the adrenoreceptor.
In order to do so, we first have to add Hydrogens to all present molecules.
hands_on
- Edit - Add - hydrogens to : All
- Change the display of the ligand to Sticks
- Select the amino acids of the binding pocket i.e. a sphere of 10 Angstrom around the ligand
Select – in sphere around – Residue and drag with the mouse until the display says 10 ÅView – show interactions – hydrogen bonds of - Residuesselect ‘Selected’ in the panel Belongs to or has and press OK in the subsequent window
Given that hydrogen bonding is dependent on the definition of a hydrogen bond in the program, it is not a bad idea to use other tools to compare the analysis. There are many options to do this online if you look at published crystal structures. Next to the tools which are directly linked out from the web site of the crystal structure at the PDB database you can use the ProteinPlus server
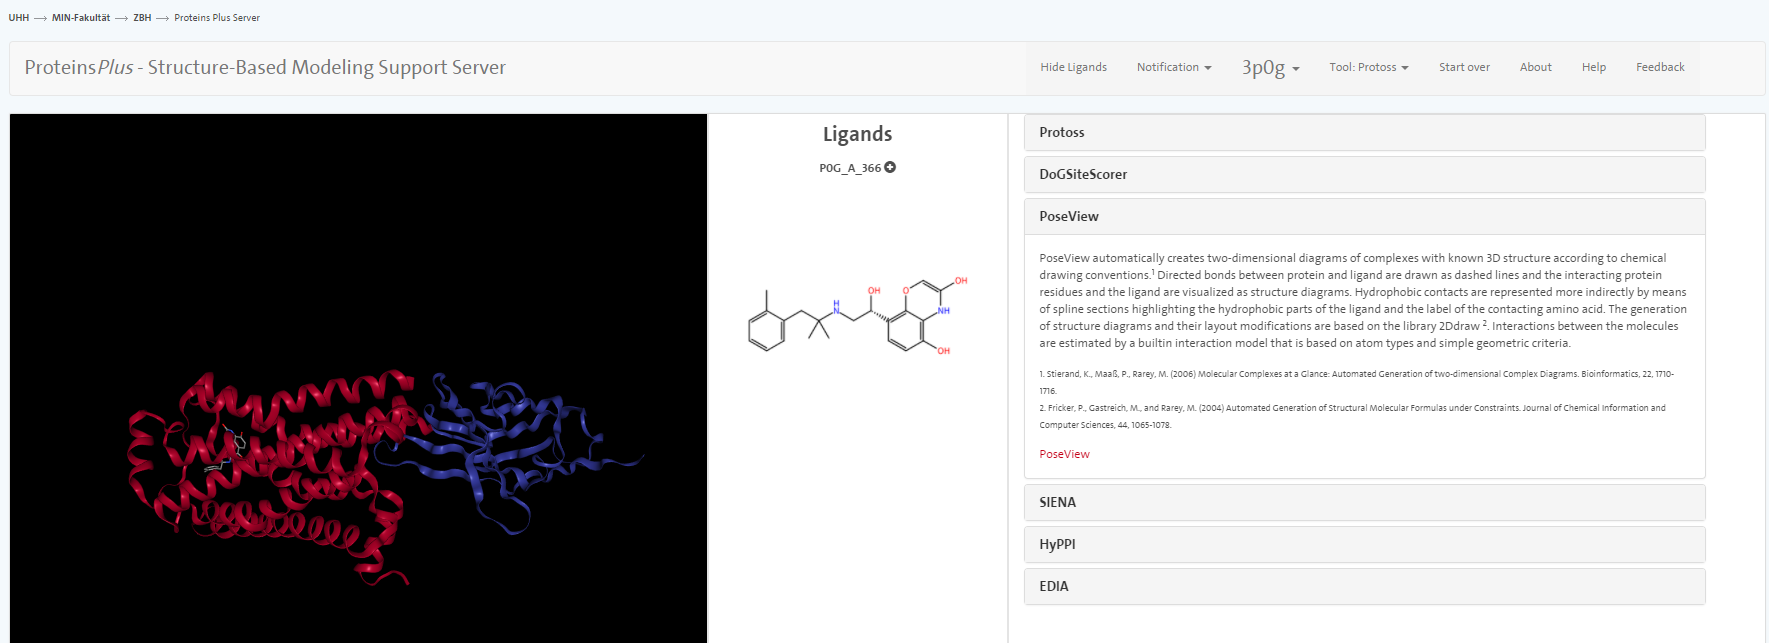
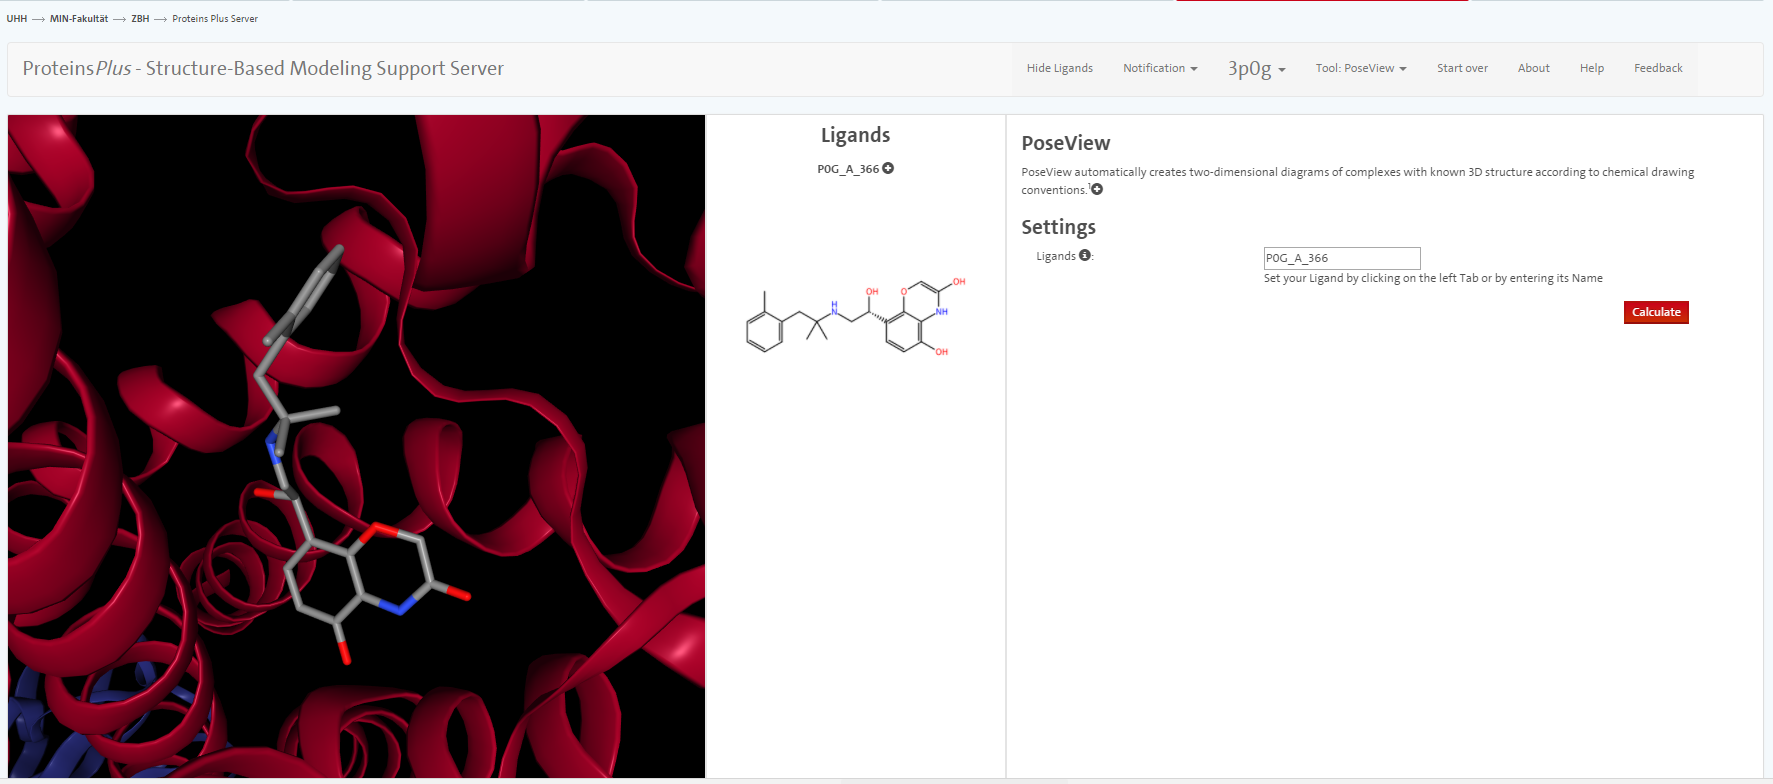
Go to the web site of ProteinPlus and enter the PDB code 3P0G into the search box. After clicking on Go, you should be presented with on overview of tools the ProteinPlus server provides.
We do not go into great detail on all the tools but only mention PoseView. With this tool, you can prepare an automatic sketch of the small molecule-protein interactions.
question Questions
- Between which amino acids and the ligand do you see hydrogen bonds using YASARA?
- According to PoseView, between which amino acids and the ligand do you see hydrogen bonds?
- What other interactions are presented in the sketch?
- Inspect the visualisation in Yasara: Do you see the interactions in Yasara as well?
solution Solution
In YASARA, you observe hydrogen bonds between Asp113A as well as the carbonyl function of Asn312A and the charged amine function.
PoseView indicates hydrogen bonds between Asp113A as well as the carbonyl function of Asn312A and the charged amine function. Furthermore, hydrogen bonds are indicated between the phenolic OH and Ser207A and Ser203A as well as the amine function and Ser203A.
Furthermore, hydrophobic interactions are indicated for the methylbenzyl moiety and pi-pi interactions of Phe290A and the phenolic moiety.
With YASARA Structure license, those hydrophobic interactions can also be visualised.
Exploring the structure of a nanobody-stabilized active state of the β2 adrenoceptor - the nanobody
In order to estimate the binding energy between the nanobody and the β2 adrenoceptor, we can use the FoldX tool AnalyseComplex. It is recommended to calculate these binding energies on energy-minimized structures. To illustrate the effect of the energy minimization, we compare the interaction energy of the current crystal structure and its minimized structure.
Use the tool FoldX tool AnalyseComplex
hands_on
Given that energy-minimization takes a while for this rather large complex, please download the Yasara scene here
Calculate the interaction energies between the chain A and B of the object 3P0G and the RepairObj1, respectively.
Analyze - FoldX - Interaction energy of molecules
question Questions
- What is the dG in the two cases?
- Any idea why the difference is rather hugh?
solution Solution
- first case (X-ray structure): Interaction energy between molecule(s) A and B in object 1 = -9.86 (kcal/mol) second case: Interaction energy between molecule(s) A and B in object 2 = -20.19 (kcal/mol)
- Through the energy minimisation of the Repair Object function, the interactions of the amino acids are optimised.
This command also creates a list of residues forming the interface of the two proteins. Hit space to see the list of residues in the interface.
Tip: This list can also be useful if you want to make visualisations of the interaction site.
Plugin>interface residues between A and B
Plugin>TA66 TA68 IA72 IA127 RA131 AA134 IA135 TA136 SA137 PA138 FA139 KA140 QA142 YA219 VA222 EA225 AA226 LA266 KA267 EA268 AA271 LA272 TA274 LA275 IA278 IA325 YA326 RA328 SA329 PA330 SB27 IB28 FB29 SB30 IB31 TB33 AB50 IB51 eB52 SB56 TB57 NB58 YB100 AB102 VB103 LB104 YB105 EB106 YB107
Comparing the active and the inactive conformation of the β2 adrenoceptor
In case, there is still time, I would recommend to try to use some of your capabilities you learned today and create a superposition of the inactive and active conformation of the β2 adrenoceptor. We take one of the crystal structures which are available: 3SN6
File - Load - PDB file from Internet
You will be kind of overwhelmed once the structure is loaded into YASARA. In order to get a first quick overview, click on the ‘Center’ buttom in the menu of YASARA (5th buttom from the left). Then, it is time to look at the PDB entry of 3SN6 in the PDB database to have a first idea on what molecules are in the PDB file.
As you see on the website 3SN6, the chain R consists of 2 molecules, the β2 adrenoceptor and lysozyme. In the corresponding article, it is stated that ‘the unstructured amino terminus of the β2AR is replaced with T4 lysozyme (T4L)’.
Since this is an extra molecule in the crystal structure which disturbes our view, we will delete it.
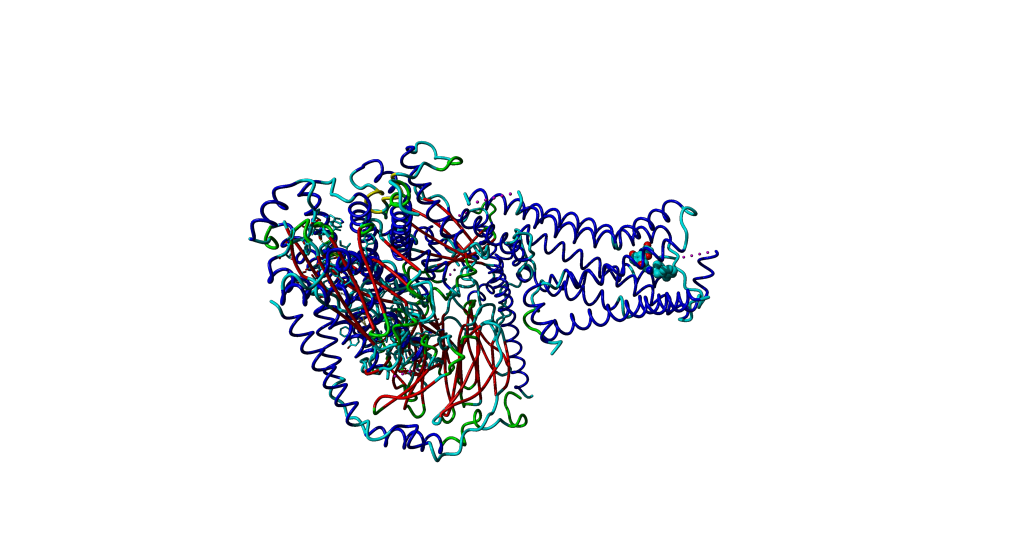
After the manipulation, the overall picture should look roughly like this.
In the following step, we structurally align only the receptors. The rest of the structures will move along. It is suggested to use the first chain A from 3P0G as target. In order to do a structural alignment, it is suggested to use the first chain A from 3P0G as target.
Analyze - Align - Pairwise, based on structure - Molecules with MUSTANG
Investigate the differences in TM helices and the binding of the nanobody compared to the subunit of the G protein.
Tip: Color the secondary structures to better identify the individual chains/units of G protein.
Conclusion
Sum up the tutorial and the key takeaways here. We encourage adding an overview image of the pipeline used.
keypoints Key points
- Visualisation of interaction types depends on settings of the visualising tool.
- Visualisation techniques together with structural alignment lead to the discovery of biological insights.
Useful literature
Further information, including links to documentation and original publications, regarding the tools, analysis techniques and the interpretation of results described in this tutorial can be found here.